Platform Highlights
See the 3forge Application Engine in action. Browse dashboards, analytics tools, and workflow applications built for the world's leading financial institutions.
Showcase
The following fully-functional applications were entirely built by AI using 3forge components from a Requirements document, often in just hours.
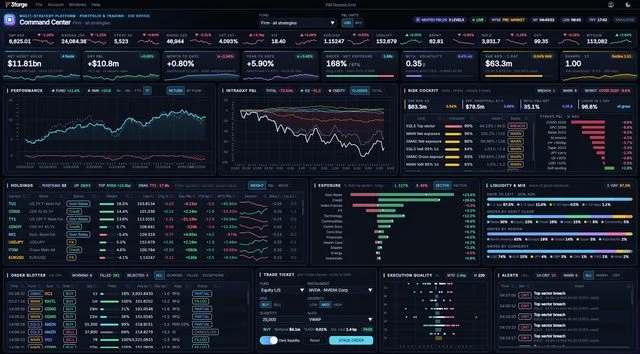
Firm-wide P&L, exposure, risk limits and order flow across every strategy, with nested grids that drill three levels deep.
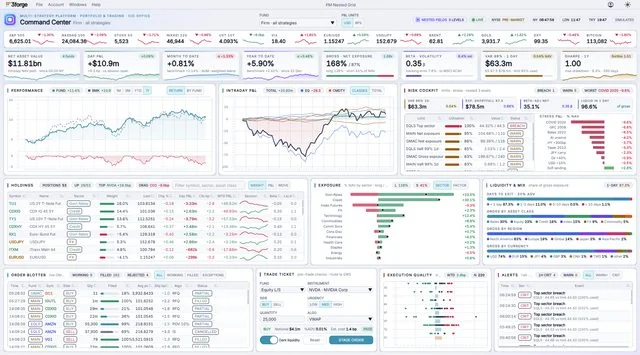
The same dashboard in the light theme: one layout, restyled without touching the application.
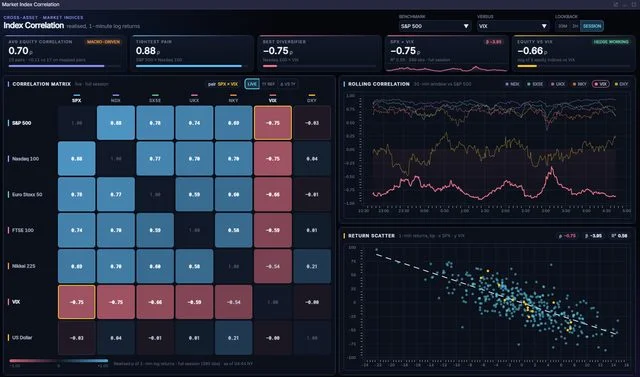
Live correlation matrix, rolling correlation and return scatter across equity indices, the VIX and the dollar.
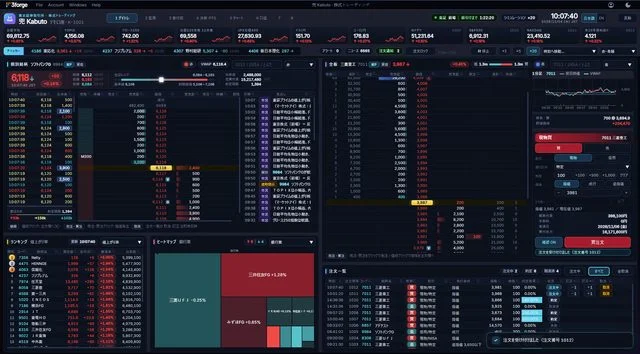
A Tokyo equities trading screen in Japanese: tape, full-depth order book, news, rankings, sector heatmap and order entry.
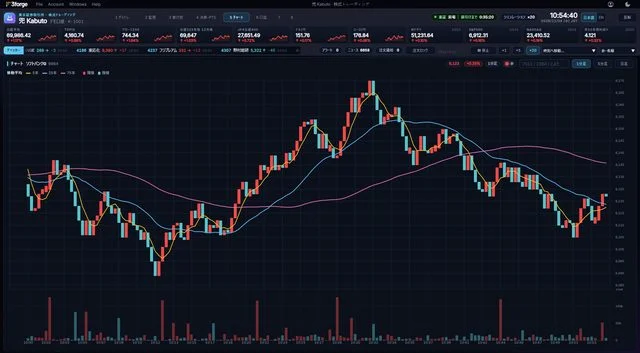
One-minute candlesticks with 5, 25 and 75-period moving averages and volume.
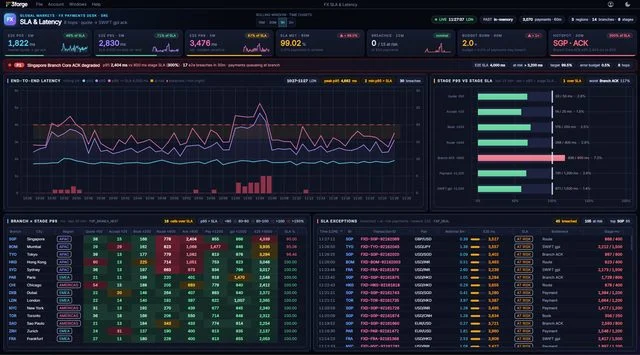
End-to-end payment latency against SLA, stage by stage and branch by branch, with breaches flagged as they happen.
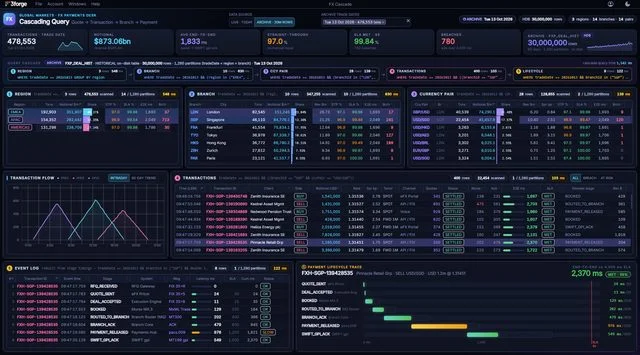
Drill from region to branch, currency pair, transaction and lifecycle across a 30-million-row archive, each step answered in milliseconds.
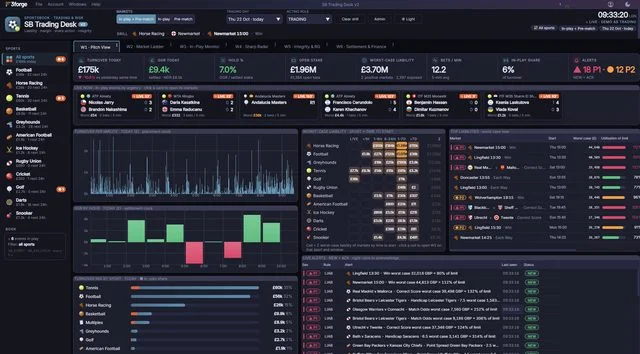
Turnover, margin, worst-case liability by sport and live alerts for a sportsbook trading team.
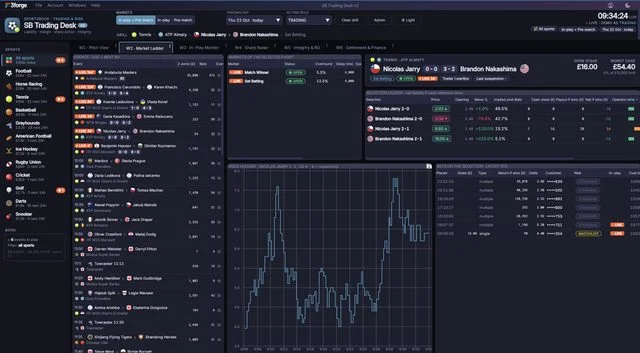
Net liability per selection, price moves and the latest bets for a single market.
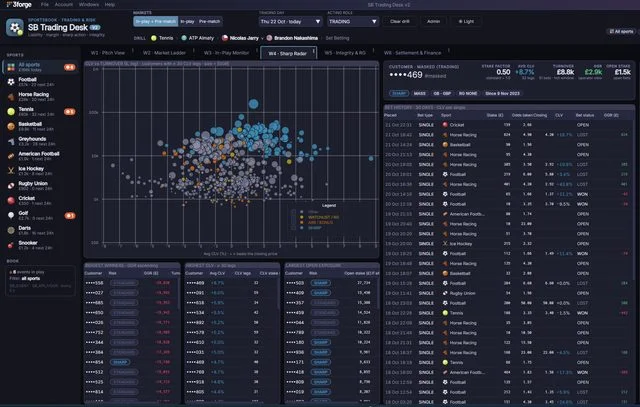
Customers plotted by closing-line value and turnover, with bet history and a stake-factor recommendation.
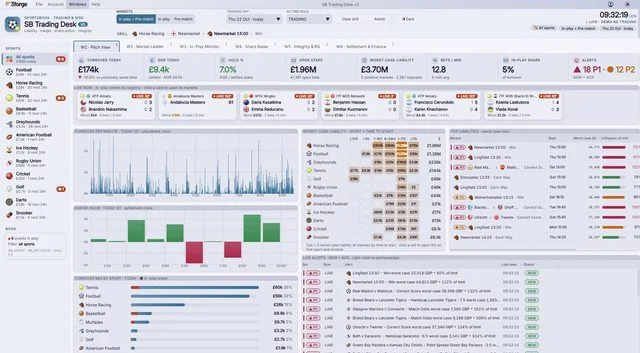
The same trading desk in the light theme: one layout, restyled without touching the application.
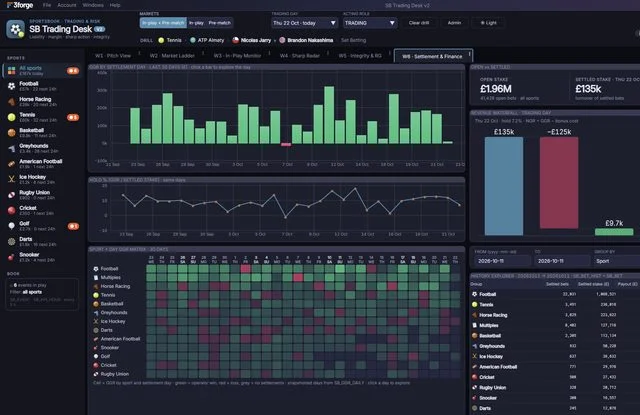
Gross gaming revenue by day and sport, hold, a revenue waterfall and a history explorer.
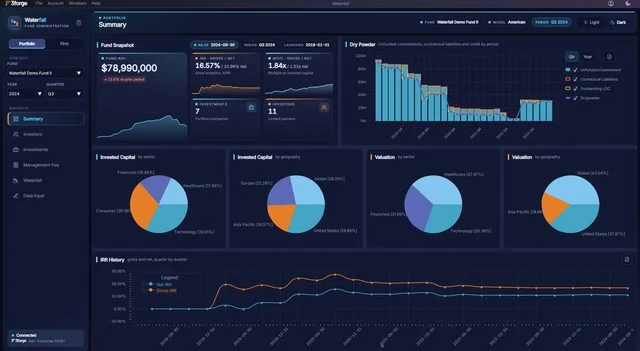
NAV, IRR, MOIC, dry powder and invested capital by sector and geography for a private equity fund.
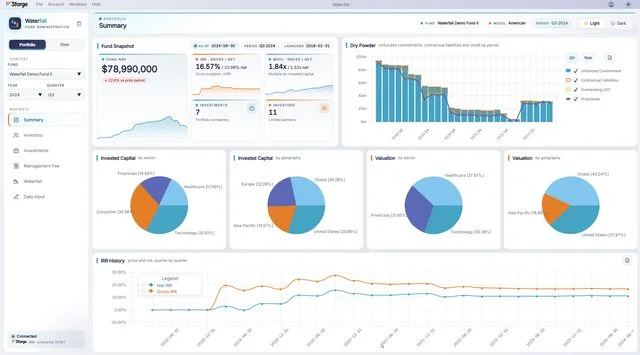
The same fund summary in the light theme.
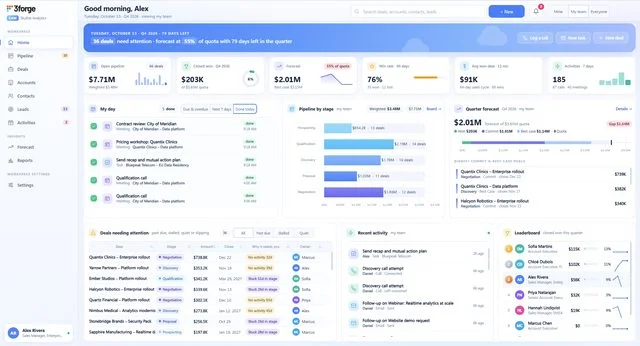
A sales team's day: pipeline, forecast against quota, deals needing attention and a leaderboard.
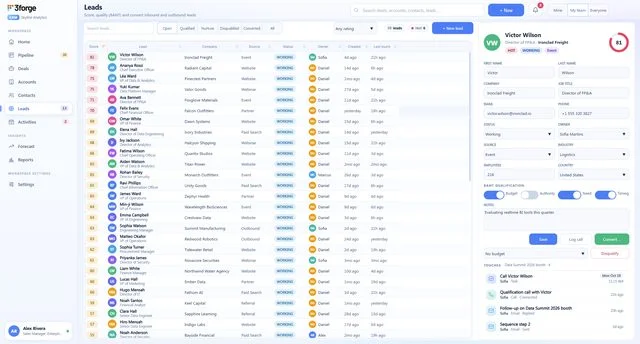
Score, qualify and convert leads, with BANT qualification and every touch in one panel.
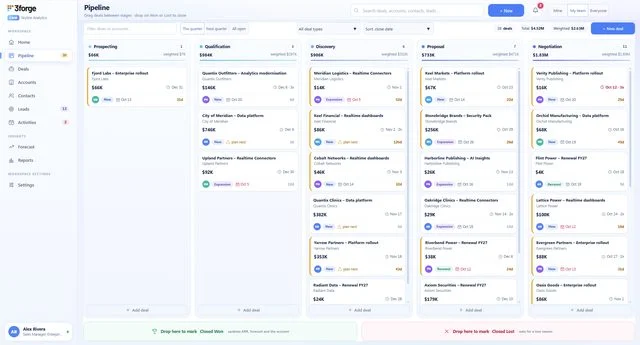
Drag deals between stages and drop them on Won or Lost to close.
Use Case
Real-time NAV, performance attribution, and risk metrics across all positions, consolidated into a single live dashboard.
Monitor firm-wide exposure and performance in real time, with drill-down into individual books and desks.
Full cash waterfall model with distributions, carried interest allocation, and LP/GP splits at the deal level.
Model hypothetical distribution scenarios before actual capital events, with full LP/GP sensitivity analysis.
Track capital calls, distributions, and net allocations across the full LP roster with real-time updates.
Investment-level analytics with benchmark comparison, attribution breakdown, and exposure summary across all portfolio companies.
Watch how 3forge enables live rebalancing workflows with instant constraint checking and order generation.
Interactive tool letting portfolio managers adjust allocations and immediately preview risk and exposure impact.
Use Case
Country-level attribution analysis showing contribution to returns across geographic exposures in real time.
Manager-level performance analytics covering returns, risk metrics, and contribution to total portfolio.
Drawdown monitoring with benchmark comparison, recovery analysis, and historical stress scenario overlays.
Track cumulative net alpha generation over time with country-level decomposition and benchmark comparison.
Real-time limit utilization across positions, geographies, and asset classes, with breach alerting.
Multi-dimensional exposure breakdown by sector, geography, currency, and instrument type.
Cross-system risk aggregation and standardized reporting via the 3forge Open Protocol integration layer.
Automated file tracking and reconciliation with counterparty data feeds, with exception management workflows.
Use Case
Staying on top of thousands of FIX messages, from the raw message to business-level chains of orders, with powerful filtering and message analysis throughout the trading day.
Comprehensive TCA dashboard measuring execution quality against benchmarks across asset classes and venues.
Real-time order flow monitoring with live P&L, position, and execution quality metrics across all desks.
Consolidated order data view aggregating execution activity across multiple venues and asset classes.
Market microstructure dashboard for corporate bonds showing spread dynamics, volume trends, and price levels.
Scatter chart analysis of desk positions showing risk/return distribution and concentration across the book.
Fund vehicle performance tracking with NAV calculation, returns attribution, and real-time investor reporting.
Platform
Watch how LivePivots™ delivers real-time analytical pivot tables on billions of rows with millisecond latency, with no pre-aggregation required.
See the data fabric in 3forge Enterprise serve both real-time and resting data straight into Python, Excel, React, and other downstream tools from a single governed access layer.
See how teams build fully custom trading and analytics UIs without writing front-end code.
More demosComplex multi-series charts with real-time streaming data, synchronized panels, and full custom theming.
More demosWalk-through of the 3forge theming engine: complete visual customization of layouts, colors, and components without a front-end developer.
More demos
Real-time drag-and-drop layout tool. Build and deploy production dashboards without writing front-end code.
More demos