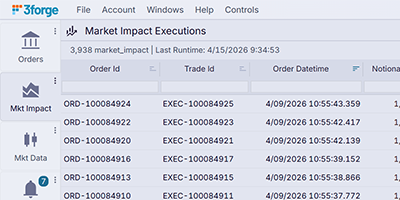
Tabs and Nested Panels
Create highly structured interfaces by nesting navigation components, such as dividers within tabs or multiple levels of panels, for streamlined data exploration.
Application Delivery
Where data and logic can turn into complex user interfaces that support mission-critical workflows.
Function inside the fabric
Web Servers connect users to real-time and historical information through interactive tables, forms, trees, charts, maps and pivots. These components are not limited to passive visualization. They accept input, invoke server-side logic and initiate controlled actions.
Because a Web Server is part of the same runtime as the data and processing layers, the interface stays close to application state: updates reach the browser directly, and entitlements decide what each user may see and do.
A workflow can therefore begin as a live operational view, pass through forms and approvals, and become partly or wholly automated without moving into a separate technology stack.
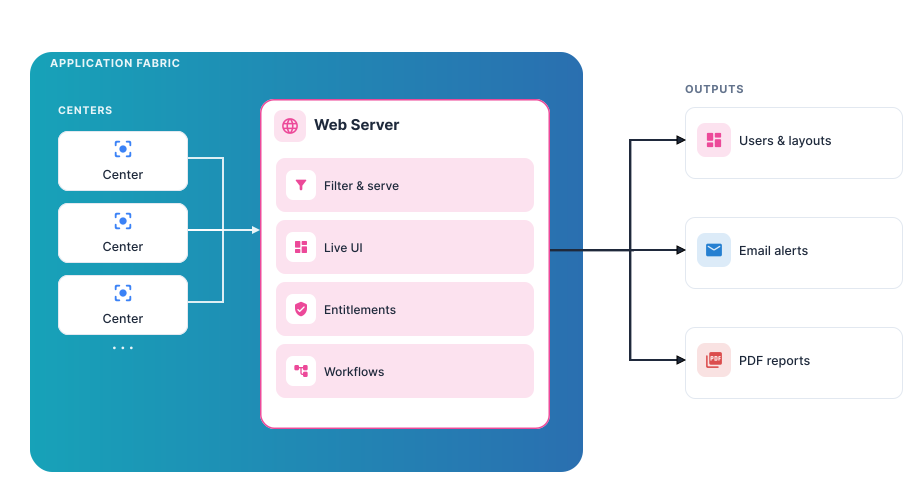
A Center holds everything an application needs except a screen: complex event processing, data virtualization and distribution, entitlements. Applications run at the core of the fabric, headless and server-side, before any interface exists. That is where the name comes from.
Web Servers present those applications to their users, through real-time interfaces shaped to each cohort. Dashboards and layouts are one highly effective way to put a UI on a fabric data flow.
Real-time aggregation
Turn pivoting from a static reporting exercise into a live capability: instant aggregation across millions of rows and thousands of columns, continuous updates in sync with every incoming data point, and entitled, workflow-aware views for every user, with no overnight refresh. LivePivots™ is delivered as part of the 3forge Application Engine.
Streamlined UI development
Engineering teams are under pressure to deliver in weeks, not months. 3forge delivers the framework and components needed to build tailored, branded experiences for traders, risk managers and operations teams, deeply integrated with hyperscale data in real time.
Create highly structured interfaces by nesting navigation components, such as dividers within tabs or multiple levels of panels, for streamlined data exploration.
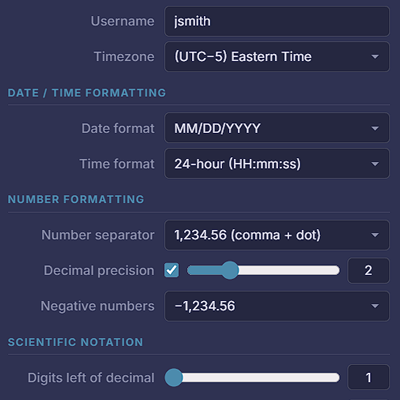
Customize content presentation with dynamic HTML capabilities, enabling rich interactivity and highly flexible user experiences directly within the application.
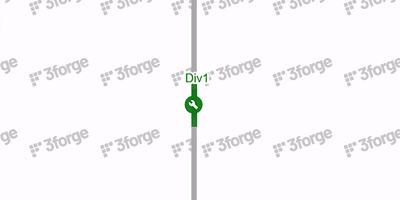
Organize complex dashboard layouts with snap-in-place dividers, providing precise, intuitive control over workspace arrangement.
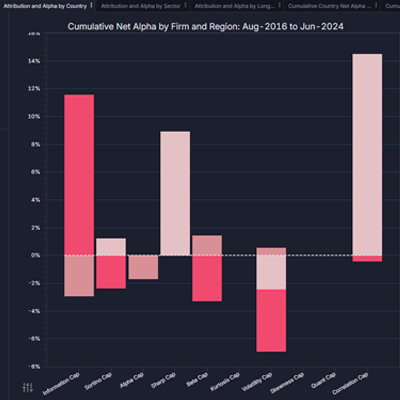
Context-sensitive views, temporary pop-ups, and on-demand interactions, keeping the interface focused, uncluttered, and highly responsive.
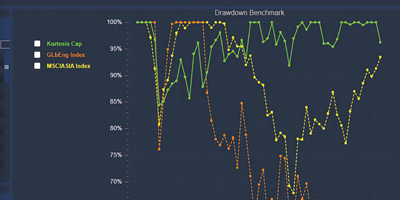
Add virtually any combination of bars, scatters, lines, areas, maps, heatmaps, canvases, radial and 3D charts that update in real time.
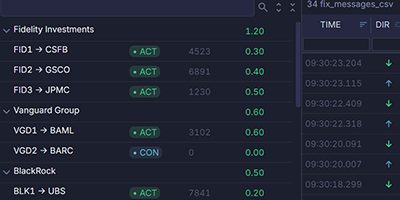
Summarize large volumes of data by computing sums, averages, counts, and other statistical measures, consolidating records into meaningful insights.
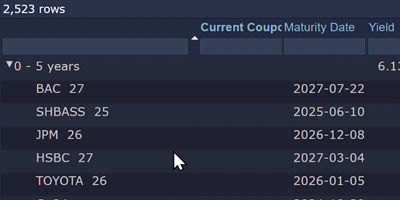
Slice large datasets into dynamic categories across hundreds of columns and millions of rows for pivots that update dynamically.
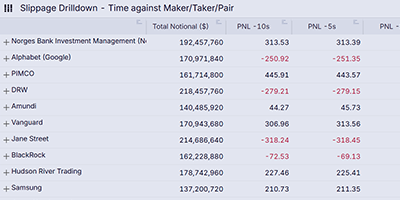
Expand, collapse, and rearrange nodes to explore relationships. Customize hierarchies and formulas for precise, scenario-specific insights.
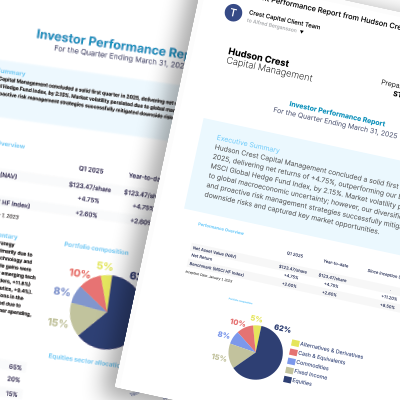
3forge can produce and deliver automated email reports configured and composed using the same live layout model as the user interface. PDF reports offer extensive customization options, blending advanced analytics with rich, intuitive visualizations.
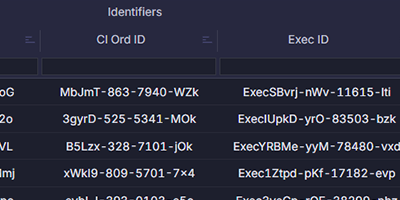
Collect related columns together under a shared header, grouping economic fields such as price and quantity so dense tables stay readable.
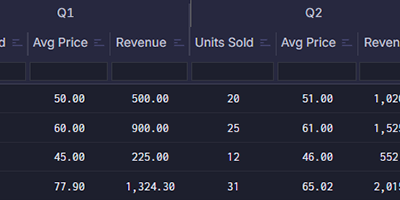
Lay out repeating sets of columns across a row, representing the same metrics over successive time periods in a single, scannable view.
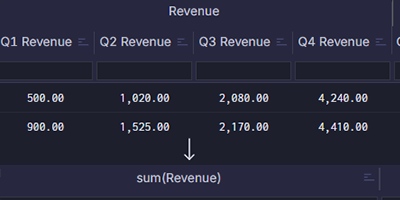
Define a relationship between columns of the same type so they can be summarized across, combining like fields into a single measure rather than rolling up rows.
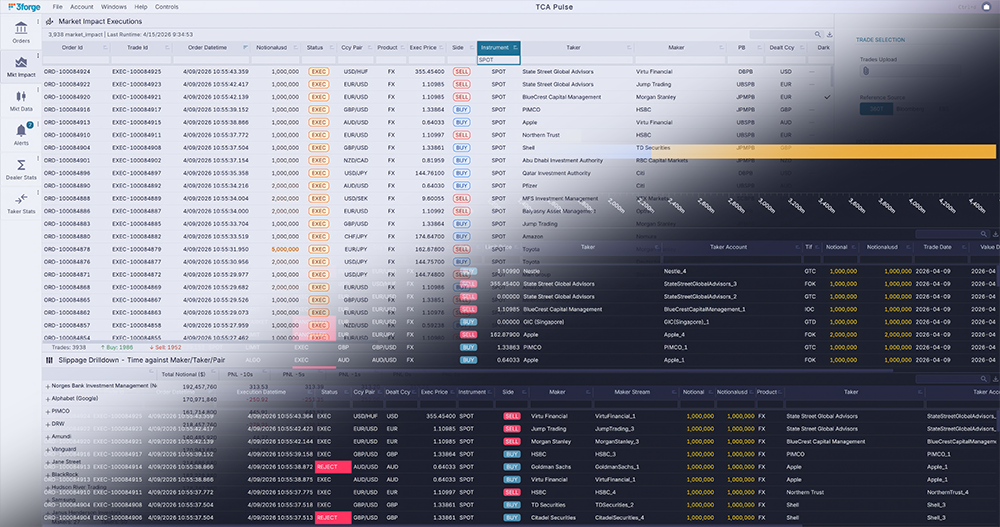
Dynamic styling and theming, light, dark, high-contrast and brand-directed palettes that update on the fly
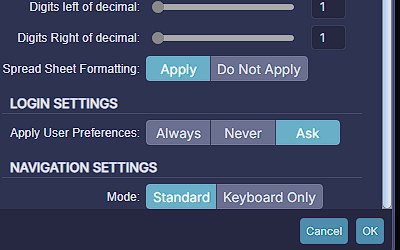
Keyboard navigation across complex dashboards, keyboard column filtering for tables and trees, and scripting support for panel navigation and focus
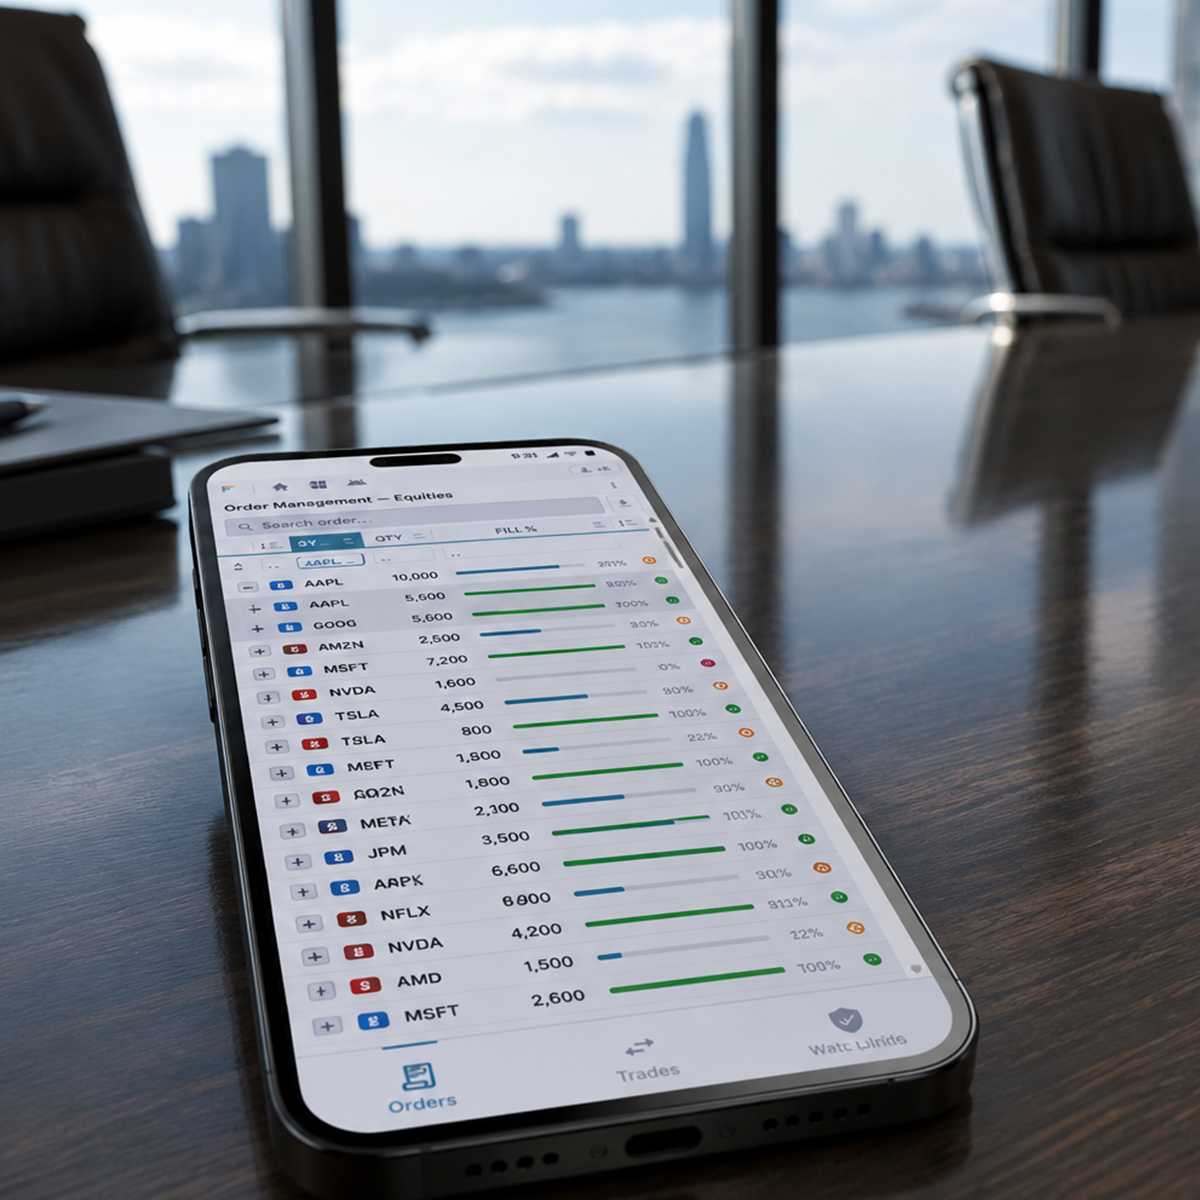
Transmission volumes are optimized enough to carry large datasets to mobile devices in real time on a browser-based mobile UI.
Common visualizations include: grouped bar charts, multi-line charts, transpose tables, pivot tables, CRUD tables, breadcrumb filters, heat maps, network graphs, 3D charts, area charts, Sankey diagrams, funnels, tree grids, boxplots, bullets, waterfalls, bumps, Gantt, candlesticks, scatter plots, pie charts, radial bars, speedometers, donuts, stacked roses, organizational charts, and more.
Tables and Trees add column grouping and cell-level data editing, for both real-time and static data. Configurable style templates for sparse and dense views, and dynamic light/dark themes complete the user experience.
Streamlined UI development
Engineering teams are under pressure to deliver quickly. The framework and the components are supplied, so the effort goes into the application rather than the infrastructure beneath it. Layouts take shape at the speed at which they are described, turning conversations into working interfaces in minutes rather than weeks.
A layout starts as a frame: the panels, tabs and dividers that determine what a user sees at once, arranged with drag-and-drop components and multi-monitor windowing.
Components bind to a data model or a feed. The model is defined in a wizard-style editor: real-time and historical sources, joins, derived columns and subscriptions, with Relays and Centers supplying what sits behind it.
The components are supplied and already bound to real-time updates.
There is no deployment step. Layouts are built and run in the same browser window, and an engineer switches from User mode to Editor mode with one control key: no executable to compile, no change to publish to the back end, no front end to refresh, no software to deploy. The effect of a change is visible immediately, in the window where it was made.
User preferences, reporting, and distribution to email, Excel and PDF are intrinsic to the interface rather than bolted on.
Engineers who prefer their own tooling can build layouts from an IDE such as VS Code, or with code assistants such as Claude Code, Codex and Copilot.
Ready for production
3forge layout components are already optimized for high performance. For instance, 3forge Enterprise delivers:
STAC, a technology-research firm that benchmarks new technologies under workloads representative of financial institutions, has independently tested 3forge Web and confirmed that it exceeds the real-time performance of traditional heavyweight front-ends.
"We found that on average, the system responded with charts of 2 million data points in roughly 3.7 seconds. We also found that as 25,000 records representing 700 thousand database fields streamed into the system every second, the system made new records available for user queries in less than 150 milliseconds on average."
Across the estate
3forge is fully compliant with the FDC3 2.0 standard, ensuring seamless interoperability and streamlined communication between financial applications across the enterprise. It is routinely deployed on enterprise-grade browsers, including industry-leading platforms such as Here (formerly OpenFin) and Interop.io.
This compatibility guarantees that 3forge integrates smoothly into existing financial technology ecosystems, facilitating rapid adoption and maximizing productivity within complex, multi-application environments.


Layout gallery
Virtually any professional application can be built with 3forge layouts with components that perform even in the most demanding circumstances. The following layouts were built with 3forge:
Application and User State
Horizontal scaling, centralized user profiles and dashboards, and load balancing across live sessions.